Making a 4300-mile / 7000-kilometer bike route of every road in Atlanta
Making a 4300-mile / 7000-kilometer bike route of every road in Atlanta
I’m a cyclist. I’m also the co-founder of Concrete Jungle, a non-profit that picks fruit from trees growing all over the Atlanta area and donates it to local homeless shelters and food banks. Both of these mean that that I’m often traveling down back roads and alternate paths, either to look for new fruit trees or just to take a more interesting route.
Several years ago, Concrete Jungle had a small project with the US Forest Service to survey the fruit trees growing in several low-income Atlanta neighborhoods: West End, Castleberry Hill, English Ave, Vine City, and Mechanicsville. As part of this project, I rode my bike down every single street in these neighborhoods and recorded every mulberry, pecan, apple, fig and pear tree I found.
The trees were actually the least interesting part of this project because these neighborhoods are known in Atlanta as being kind of mythically poor and high-crime. And, sure, they are: English Ave and Vine City are home to the infamous Bluff, the neighborhood around Vine City station was recently the fifth most dangerous in the US, and boarded-up houses are more common than not on some blocks.
But they’re also home to lots of history, new development, beautiful places, secret paths, and normal folks going about their lives.
Places like…
The Herndon House
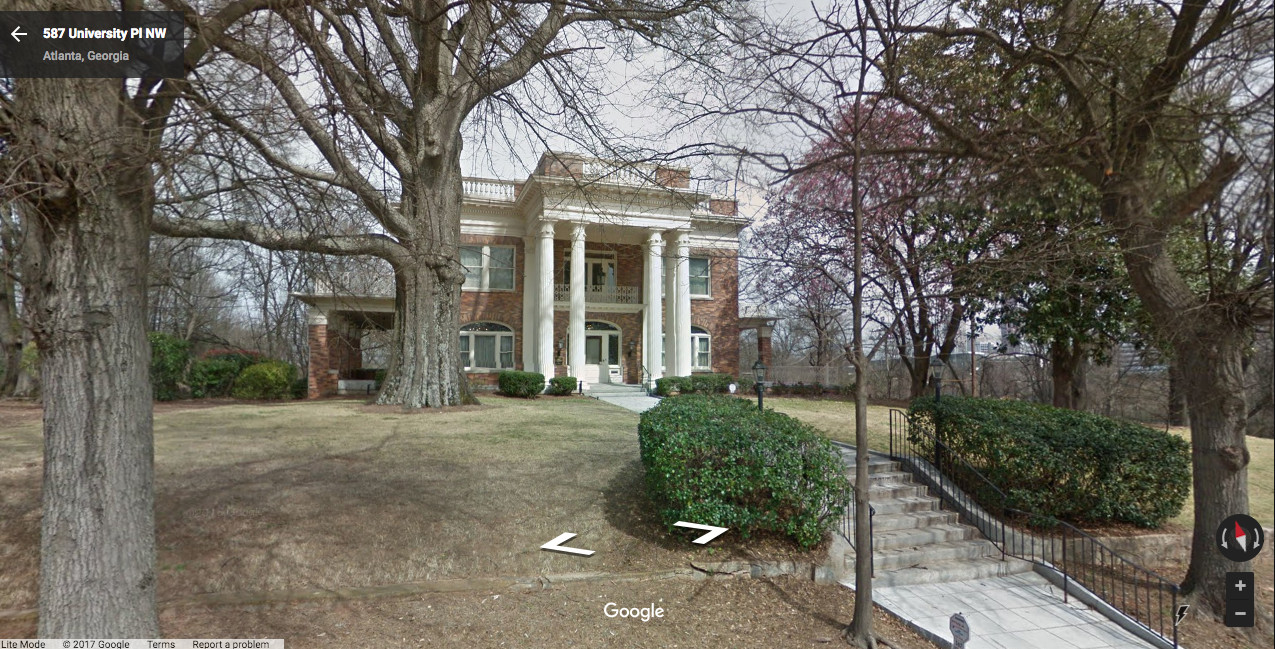 Home of Atlanta’s first African American millionaire. Born a slave. The house is very nice.
Morris Brown College
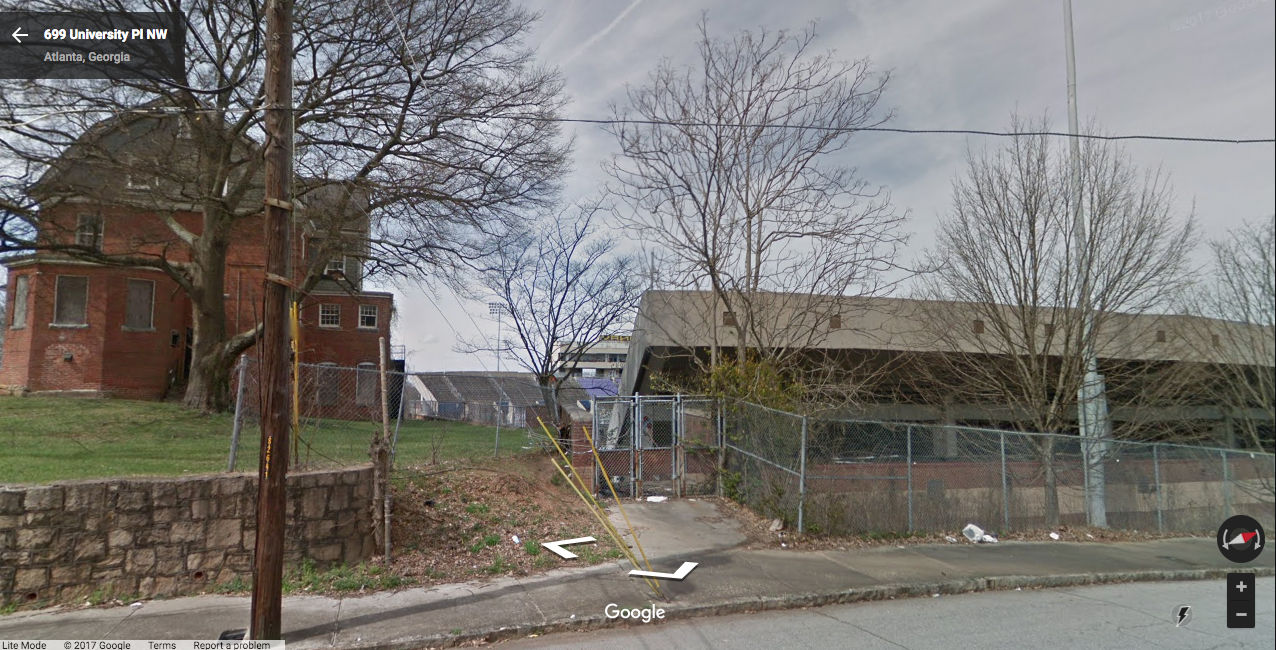 There’s an entire out-of-business college (Morris Brown) right next to the Herndon House. Founded in 1881, it recently went through an embezzlement scandal and lost its accreditation. Now it sits there.
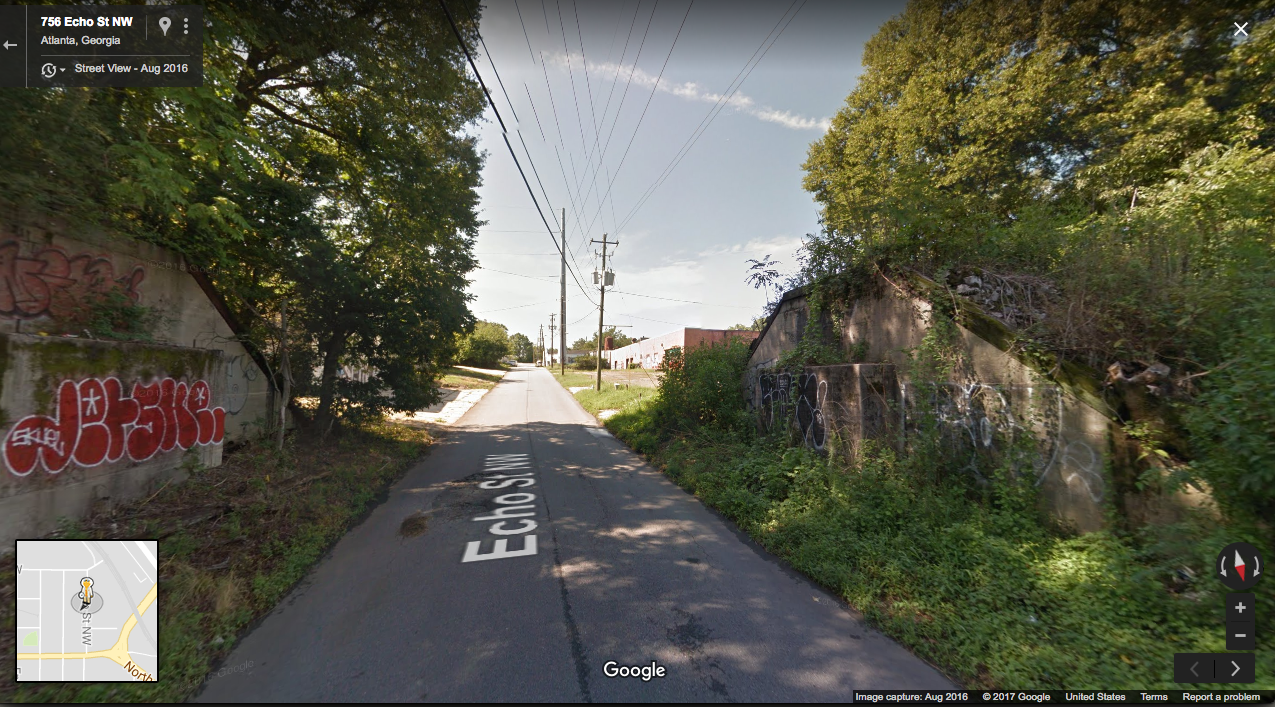 Echo St near the Atlanta Community Food Bank. Remnants of an old railroad bridge are still here. When I first biked down this street it was unpassable from flooding even though it hadn’t rained in over a week.
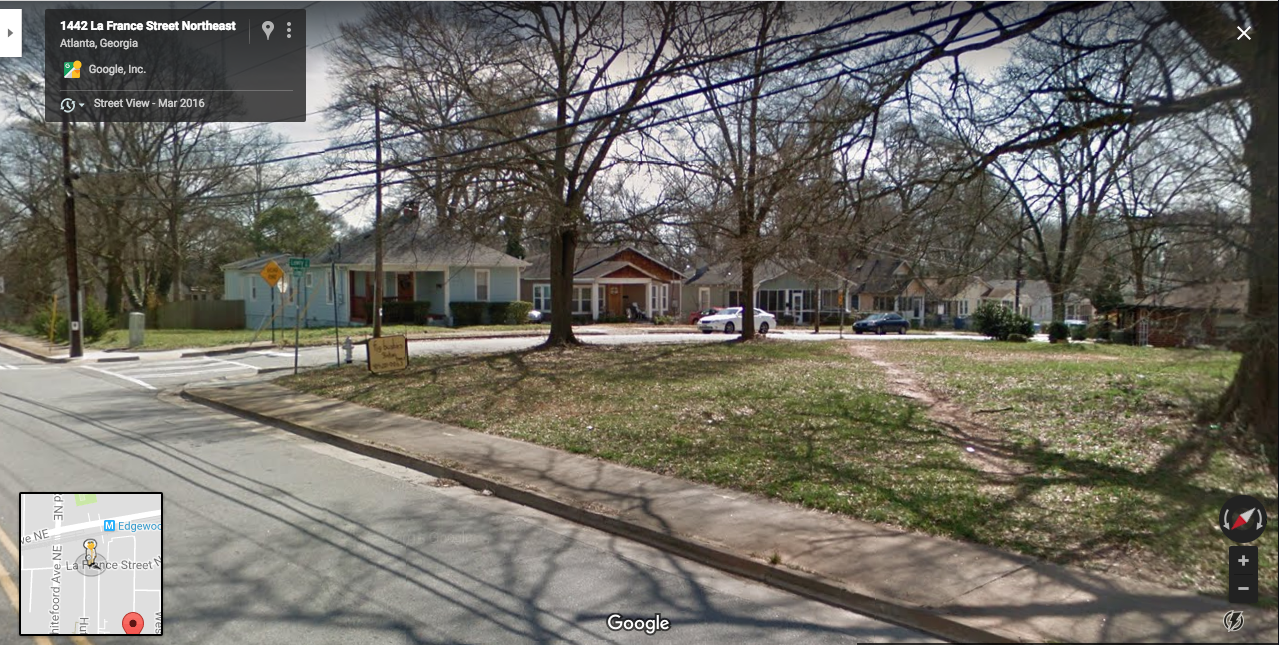
Peeples Street
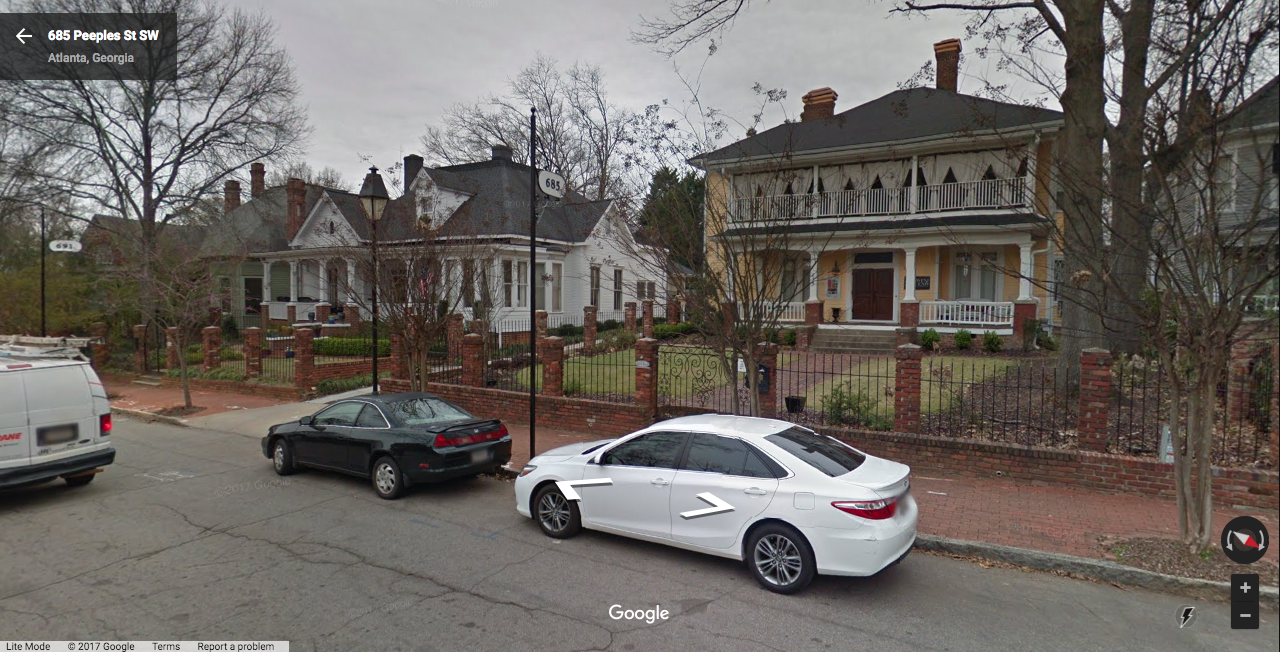 Rumored to have been spared during Sherman’s March, Peeples Street is lined with beautiful historic mansions in the middle of the West End.
Atlanta has a few factors that discourage exploration. For one, it’s very segregated, so people are used to staying in their part of town.
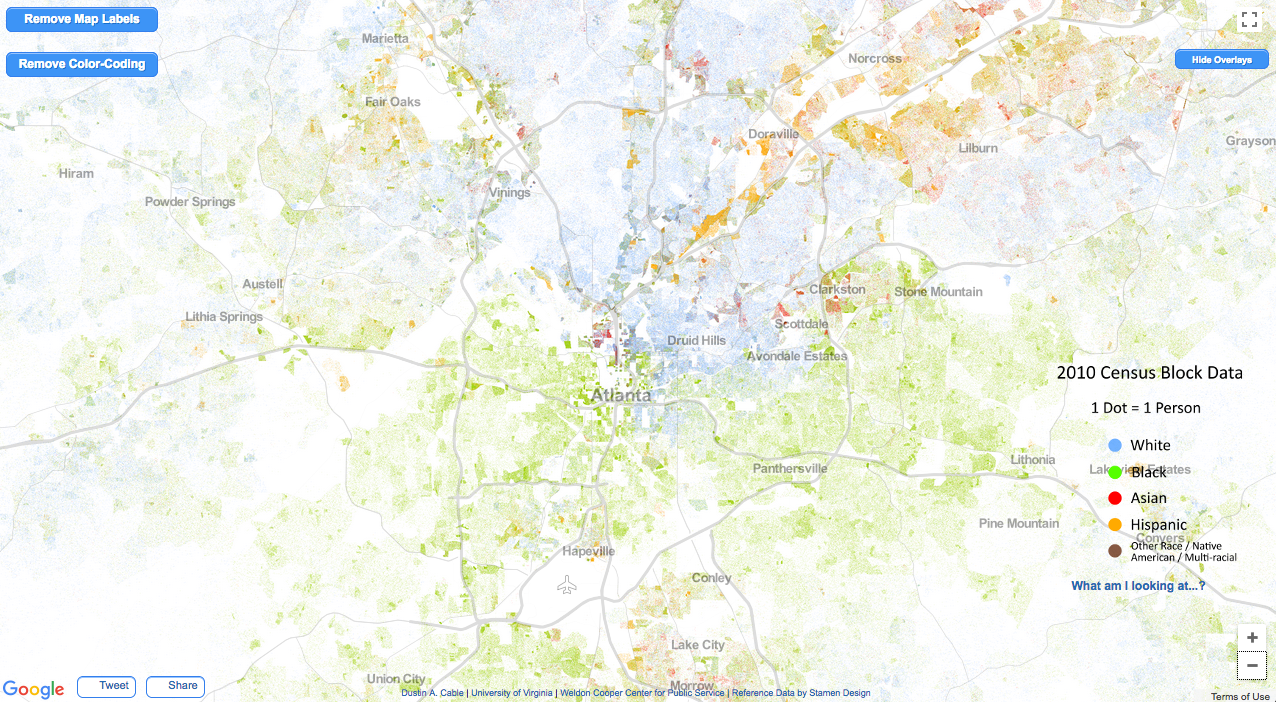 (Image Copyright, 2013, Weldon Cooper Center for Public Service, Rector and Visitors of the University of Virginia (Dustin A. Cable, creator)
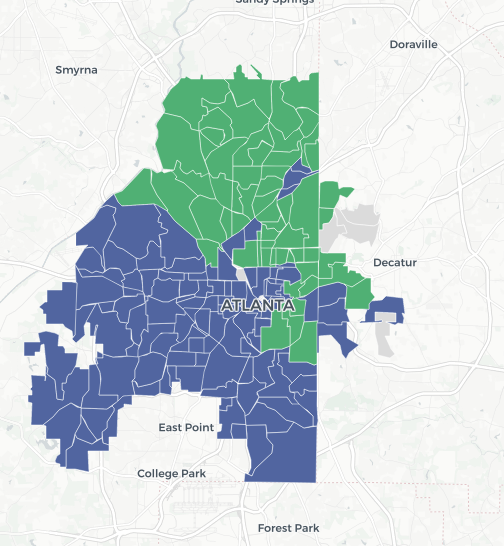
This divide makes itself present in a variety of ways, such as the 2017 Atlanta mayor’s race, shown here in AJC.com’s precinct map. Guess which candidate was white and which candidate was black.
Atlanta is also mostly not built on a grid. There’s a good chance that turning down a side-street is going to wind you around and take you some place mysterious or to a dead-end. Even after living here for over 20 years, I sometimes will travel down a new road and be amazed at its destination: “Oh THAT’S where that road goes”.
And finally, Atlanta’s just big. There’s a lot of ground to cover and most people probably aren’t going to venture some place new for no reason.
So, I have a project called All of ITP to convince people that they should venture some place new for its own sake. We regularly do 25 mile / 40 km rides around the city for the sake exploring and with the ultimate goal of riding every road inside Atlanta’s Perimeter. These rides have the notable distinction of traveling down every road in an area.
I wrote some software to create these routes and I thought it would be fun to set it loose on Atlanta’s entire inside-the-perimeter road network to see what it produces. Let’s see how it works..
Making a Map of Atlanta
Getting the data
TL;DR: Thank Glob for OpenStreetMap and BBBike because dealing with municipal GIS data collections is a pain in the butt.
I didn’t exactly know where to begin except with GIS data, which is what people use when they deal with maps on a professional basis. Most cities have their own GIS portal that details things like official boundaries, natural features, traffic lights, fire hydrants, property lines, roads, etc. This is great, but unfortunately a bit unwieldy for what we want to do.
Even though each city and county offers its own GIS portal, they are difficult to use together. The three major entities inside the perimeter are: city of Atlanta, Fulton County, and DeKalb County. City of Atlanta lies in both counties and also extends outside of the perimeter, as do both counties. Furthermore, city of Atlanta and both counties each have their own GIS quirks: different database formats, spatial reference systems, and features included in each. DeKalb County only provides GIS data in a Microsoft Access database format and doesn’t include as many features as City of Atlanta’s GIS database, which also for some reason includes parts of Fulton and DeKalb that are outside of city limits, outside of the perimeter and it has a different database schema.
Having all of these overlapping datasets is actually a big pain. You have to cut data out, transform coordinates, and reconcile all of the databases in to what you actually want.
Unfortunately, this was beginning to look like a really annoying and boring data cleanup process and that I wasn’t really able to rely on my taxpayer-funded municipal resources here.
Two services really saved the day at this point. The first is OpenStreetMap, which is like Wikipedia for world maps: anyone can edit anything at all. And much like Wikipedia, OpenStreetMap is actually really good. You do occasionally find roads labeled “Boulavard”, but for the most part OSM is really up-to-date and thorough. The second is the BBBike Extract service, which lets you draw an arbitrary shape on a map and download an extract of all OpenStreetMap data within that area. Together these get us only the data we want and all of it is in a consistent format. Draw a polygon around the perimeter, click a button, and you’re set. It takes 5 minutes.
The approach: graph theory
The problem that we’re trying to address is kind of the opposite of what people normally want. When you’re looking up directions in Google Maps, you want to get to a single destination as efficiently as possible. What we want to do is route down every single street as efficiently as possible, so we have to come up with our own solution.
Both problems relate to graph theory or network theory, relating to the study of how things are connected. This could be connections of roads (as in our case) or it could be used to model disease outbreaks, social networks, animal populations, or basically any system where you have a bunch of things connected to each other.
Here’s Atlanta after I got the OpenStreetMap data. The highlighted area shows the Fairlie-Poplar district in downtown.
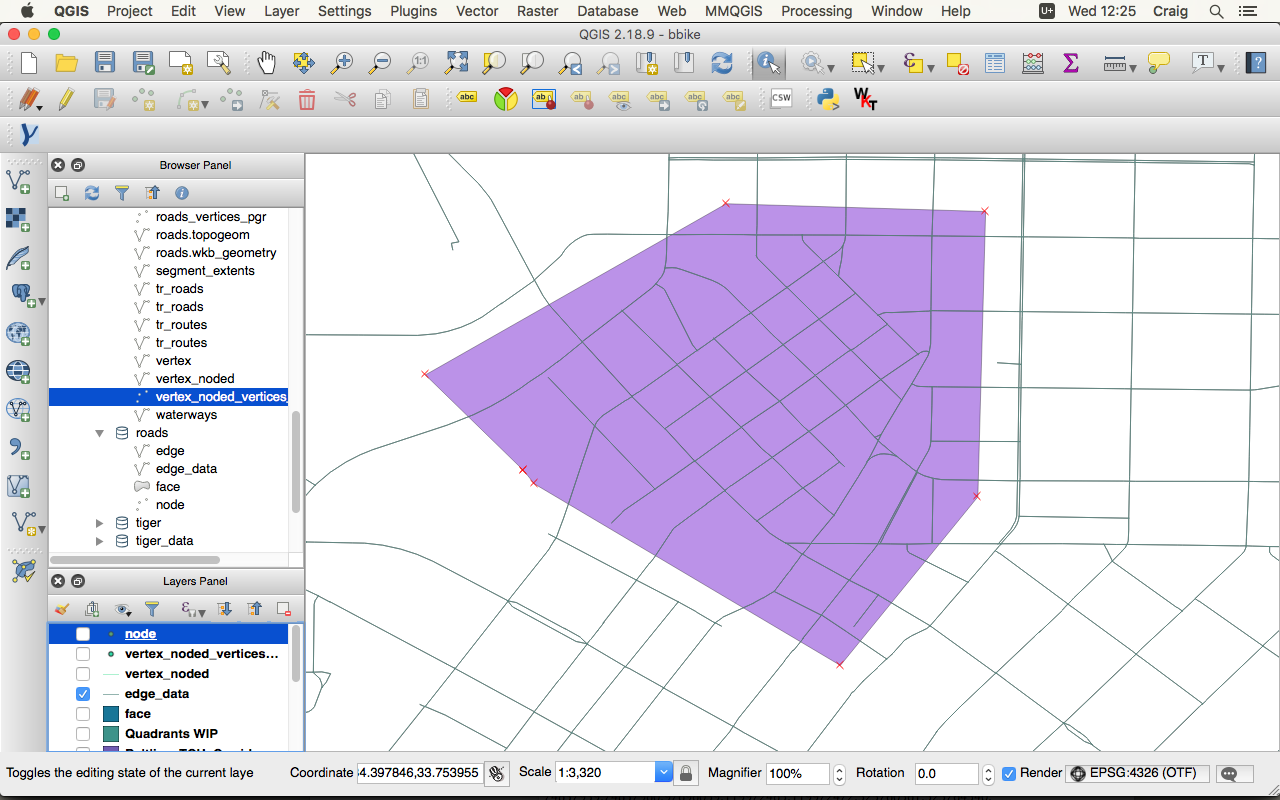
When we turn Atlanta in to a network our map turns in an abstract collection of nodes and edges. Edges are streets and nodes are where streets intersect. What we’re trying to express is how the roads are connected rather than focus on what they look like.
That same Fairlie-Popular district looks like this in network form:
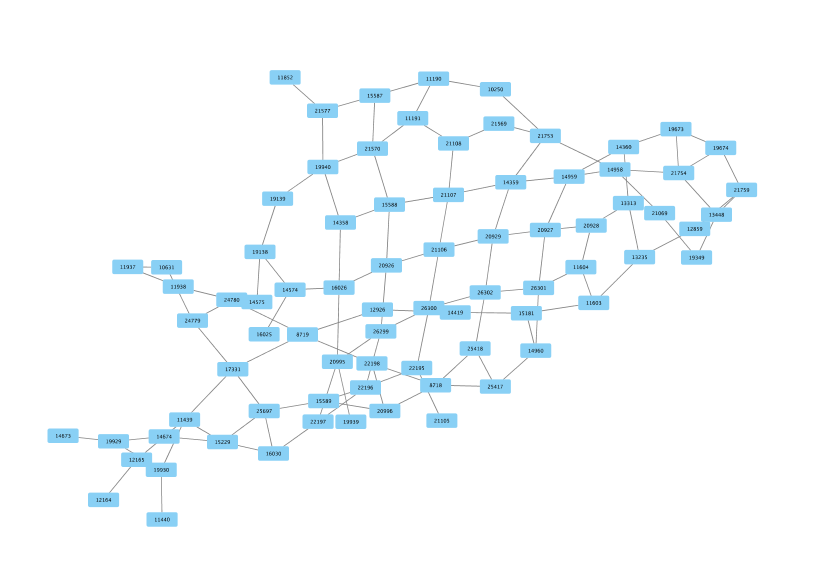
You can see that some nodes are spaced farther apart and some closer together. This is because the edge connecting each node has a weight to it, which is some cost associated with traveling along that edge. A natural candidate for the weight is length of the road: if you want to get to node A from node B, it’s going to cost you 2 miles of travel. Weight could also factor in other considerations, like number of stoplights, speed limits, presence of school zones, etc. If you’ve ever tried to get biking directions from Google Maps, they probably also have weights related to how busy the road is, whether the road has bike lanes, and maybe even how hilly a road is.
Our optimization options are limited though because we’re ultimately traveling down every street, hilly or not, busy or not, bike lanes or not. So for now we’re just using road length as our weight. As you can see below this makes for some strange routes. We could potentially optimize for making more “fun” routes in the future, but we’d have to quantify what separates “fun” rides from “not-fun” rides.
Speaking of fun, graph theorists have good names for routing problems. When I was first looking at this problem, I thought it might be a variant of the classic Traveling Salesman problem: a hypothetical salesman is traveling the country and has multiple cities that he needs to visit exactly once and then return home. What is the optimal order for visiting the cities? This problem becomes exponentially harder to solve as the number of cities in the itinerary increases.
Upon further examination, I thought then that it might be a variant of the Seven Bridges of Königsberg problem. Wikipedia’s description:
The city of Königsberg in Prussia (now Kaliningrad, Russia) was set on both sides of the Pregel River, and included two large islands which were connected to each other, or to the two mainland portions of the city, by seven bridges. The problem was to devise a walk through the city that would cross each of those bridges once and only once. By way of specifying the logical task unambiguously, solutions involving either reaching an island or mainland bank other than via one of the bridges, or accessing any bridge without crossing to its other end are explicitly unacceptable.
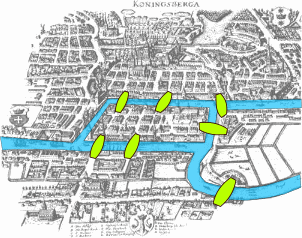
(The seven bridges of Konigsberg)
Leonhard Euler proved that the Seven Bridges problem is unsolvable as stated: some bridges must be crossed twice.
How do we know this? Aside from the start point and the end point, any other point that we pass through needs both an entrance and an exit. Otherwise you get stuck and can’t leave a point after you’ve arrived. So any point that has an odd number of connections is a problem since it will be lacking an exit.
This led to the concept of an Eulerian circuit, a walk through a town/network that covers every edge once and only once (this will be important later); and a Eulerian Graph being one that has a Eulerian circuit.
Closely related to this is the Chinese Postman problem, which is the problem we actually face in making a route for all of Atlanta: suppose you’re a mailman (of any nationality) and wish to travel every road in a neighborhood using a short a route as possible. This is much less strict than the Seven Bridges problem since you can travel roads more than once so long as we ultimately travel every road. The question then becomes: which roads do we travel more than once?
How do we even approach this? We know that if we’re traveling a section more than once then our graph isn’t Eulerian. But could we modify the graph in some way to make it Eulerian? The answer is yes, but it will involve a little trickery.
The algorithm
One way to understand what we need to do is to think about a dead-end road: if we travel down a dead-end road, then we’ve passed by the houses on that road once and we’re good. We reach the end of the road and need to turn around to return to the main road. But doing so would mean traveling back the same way we came, violating our Eulerian requirement of “once and only once”.
The way to solve this is to duplicate some roads in the graph: we insert phantom roads that don’t exist in the real world but are necessary for route computation purposes. When we travel to the end of a dead-end road, we return to the main road along one of these phantom roads. We’re technically just going down the same road twice, but to our routing algorithm we’re proceeding on to a different segment that just happens to be identical to our original road.
So then the next question to be answered in making a graph Eulerian is: what edges do we duplicate? Obviously dead-ends, but what else?
As we discussed above, the answer is “any node connected to an odd number of other edges.” It will need to have some duplicate edges added to it until its connectivity becomes even. The number of other edges connected to a node to is referred to as its degree. A dead-end has a degree of 1 since it’s only connected to 1 other road. A ‘T’ intersection has a degree of 3, etc. But basically all odd-degree nodes need to be turned in to even-degree nodes.
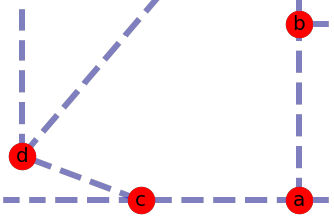
One way we could do this is start with node A, find its closest odd neighbor (C), duplicate the edges between them and move on to the next odd node (which will be node B, because both A and C have duplicate edges and are no longer odd). This was my first approach and it produced routes that were about 50% longer than the “raw” mileage.
The problem with this approach is that it’s short-sighted. It only considers things from A’s perspective, then from B’s perspective, then D’s perspective, etc. If you look at the image you can see that it makes more sense for C and D to be paired and for A to pair with B even though B is slightly farther away than C.
So we need an approach that can consider all odd nodes at once and find what’s globally-optimum, not just what’s best for each node one-by-one.
The matching
To understand how it to do this, Let’s introduce another graph theory concept, the matching.
A matching is a set of edges (roads) where no node (intersection) repeats. That’s it. It’s hard to see immediately what this is useful for, but matchings get their name because they are often used in matchmaking. You have two groups and you need to match them up the best way possible. A classic example is the “stable roommates” problem: a group of people, each with preferences about whom they’d like to have as a roommate, need to be matched up optimally.
Or a group of kids and a group of presents: each child has preferences about which present she would like to receive, so what’s the best way to do it, even if it means a child receives her 2nd or 3rd choice?
Or if you’ve ever known someone who has gone to medical school in the US then you know one of the most important days in that process is Match Day: each medical school received many applications and formed its preferences about whom it would like to admit. Students likewise submitted applications to several schools and made their own preferences about where they would prefer to attend. They’re matched up as best as can be and Match Day is the big reveal.
Our previous definition of a matching, “a group of edges with no repeating nodes”, makes more sense now: no nodes repeat because each one is paired with only one other node: one present to one child, one student to one school. We can apply this to route making.
Let’s say we took our giant Atlanta road network and found all of the odd-degree nodes. We know we have to duplicate the paths between each pair of nodes but aren’t sure which paths are the best to make.
This is a matchmaking problem: we’re just figuring out which nodes want to be roommates. If we use the closeness between nodes as their preference for each other then we can find our shortest route: we only duplicate edges between nodes that successfully match, and only nodes that are closest to each other will match. Any node that wants to match with an already-matched node will have to settle for second-best.
Suppose this image represented a portion of the odd Atlanta node network. Each node has a connection to every other node in proportion to the distance between them. Nodes 0 and 4 wouldn’t pair up because the distance between them is so large, for instance.
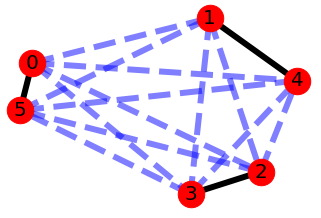
The concept of the matching can be used to think of all possible ways that we can create our phantom streets. The image has 1-4, 2-3, 0-5 highlighted as one matching (and clearly the optimal matching), but 1-0, 4-5, and 2-3 would also be a matching, as would 1-3, 4-5, and 0-2. All would be acceptable for solving our Chinese Postman problem: duplicate the edges highlighted in the matching and we would have a Eulerian network. But only the first one would be optimal and minimize the number of sad kids on Christmas morning.
The shortcut
Normally, calculating an optimal matching is not a problem for smaller routes. But for a route spanning the entirety of roads inside Atlanta’s perimeter we have to take a shortcut.
That shortcut is based on the observation that an odd node is only going to have strong preferences to pair with nearby odd nodes. Sorry hopeless romantics: there’s no chance of an odd node in Northwest Atlanta preferentially pairing with one in Southeast Atlanta. The commute is just too long.
So unlike our network above, where each node has a preference about every other node, we limit our nodes to having preferences about their nearest 10 odd neighbors. This is much more manageable than trying to form a complete graph of all odd nodes. Most general-purpose matching algorithms run in O(n^3) time as well, meaning computation time scales with the cube of number of nodes we’re trying to match, so it’s very much in our interest to make our graph as small as possible.
To give you an idea, trying to form a complete graph of all odd nodes ate as much RAM as I would throw at it, topping out at over 10 gigabytes before I stopped. If I then limited preferences to the nearest 200 neighbors, it only used 3 gigabytes of ram but the algorithm ran for 8 days before I gave up on it.
If I limited preferences to the nearest 10 neighbors, the algorithm used 135 megabytes of RAM and the entire route was calculated in under 3 hours on the second-cheapest DigitalOcean server.
One nice thing about limiting our search to 10 nearest neighbors is that it will fail rather than give you a sub-optimal route. If it turned out that 10 neighbors was too few then the matching would be incomplete and we wouldn’t be able to complete our Eulerian circuit (this happened when I limited the search to 5 nearest neighbors).
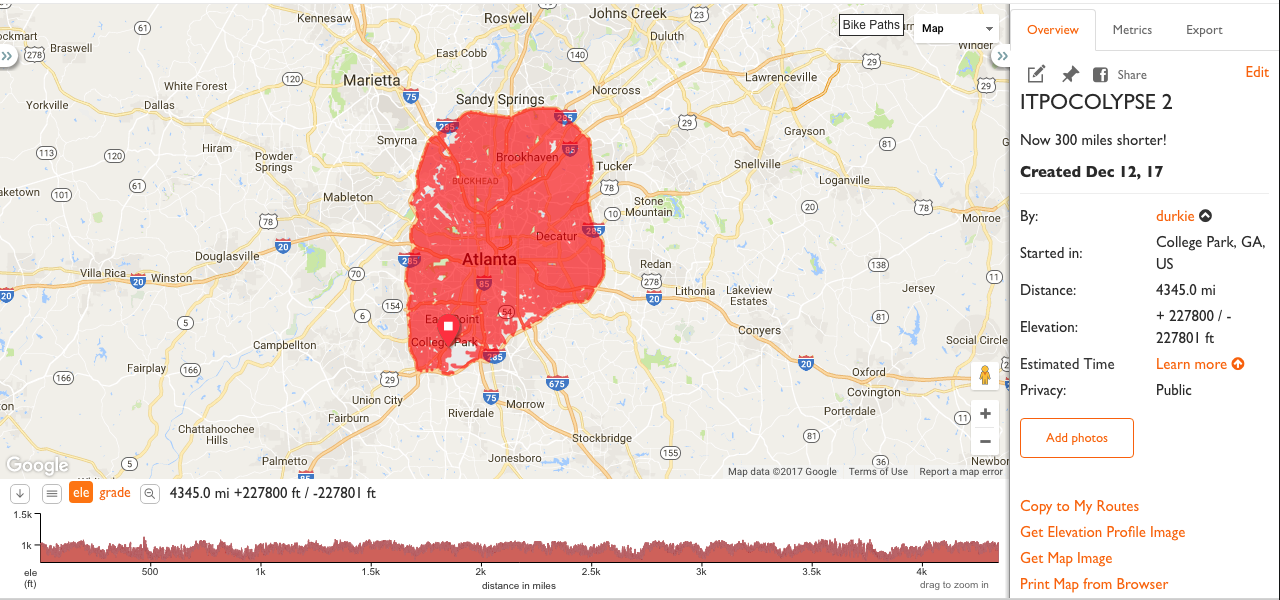
The route: ITPOCOLYPSE

…is totally ridiculous and visible here.
The GPX file (10 MB) is here: durkie.github.io/files/itpocolypse.gpx. It takes about 30 seconds just to load on my computer and occasionally crashes the RideWithGPS iOS app.
4345 miles (6992 km) and 227,800 feet (69,433 meters) of climbing/descending! See absolutely every neighborhood in Atlanta! Raw road length of inside-the-perimeter roads is 3277 miles (5273 km), so we’re over that by 33%. Not bad!
Although it’s hard to analyze on such a silly scale, 33% is actually pretty good. I use this same algorithm to generate routes on a much smaller scale for All of ITP rides and the routes hold up to visual inspection: they’re a little unusual, but aside from a few topology errors, they’re solid. I usually can’t improve the route unless it involves grouping things together a little differently (like doing a busy road section early in the ride). And they usually end up being about 25-35% longer than the “raw” road length as well.
To anyone trying to ride this route: godspeed. I want to help you achieve this in any way that I can, but I must warn you: the topology used for routing here is a bit…naive. Although Atlanta has very few one-way roads and bridges, this route knows nothing about the ones that do exist. That will have to wait for a future installment…